Underpriced Resale Data · Q3 2026
Thrift Profit Index
What resellers were asked to pay, and what it actually sells for.
Resellers check thrift finds in Underpriced before they buy. This report adds up what they checked from July 1 to September 30, 2026: the price on the tag, what those items sell for, and how many were worth taking home.
10,901 items checked by 1,318 resellers, July 1 to September 30, 2026. Published . How it’s counted
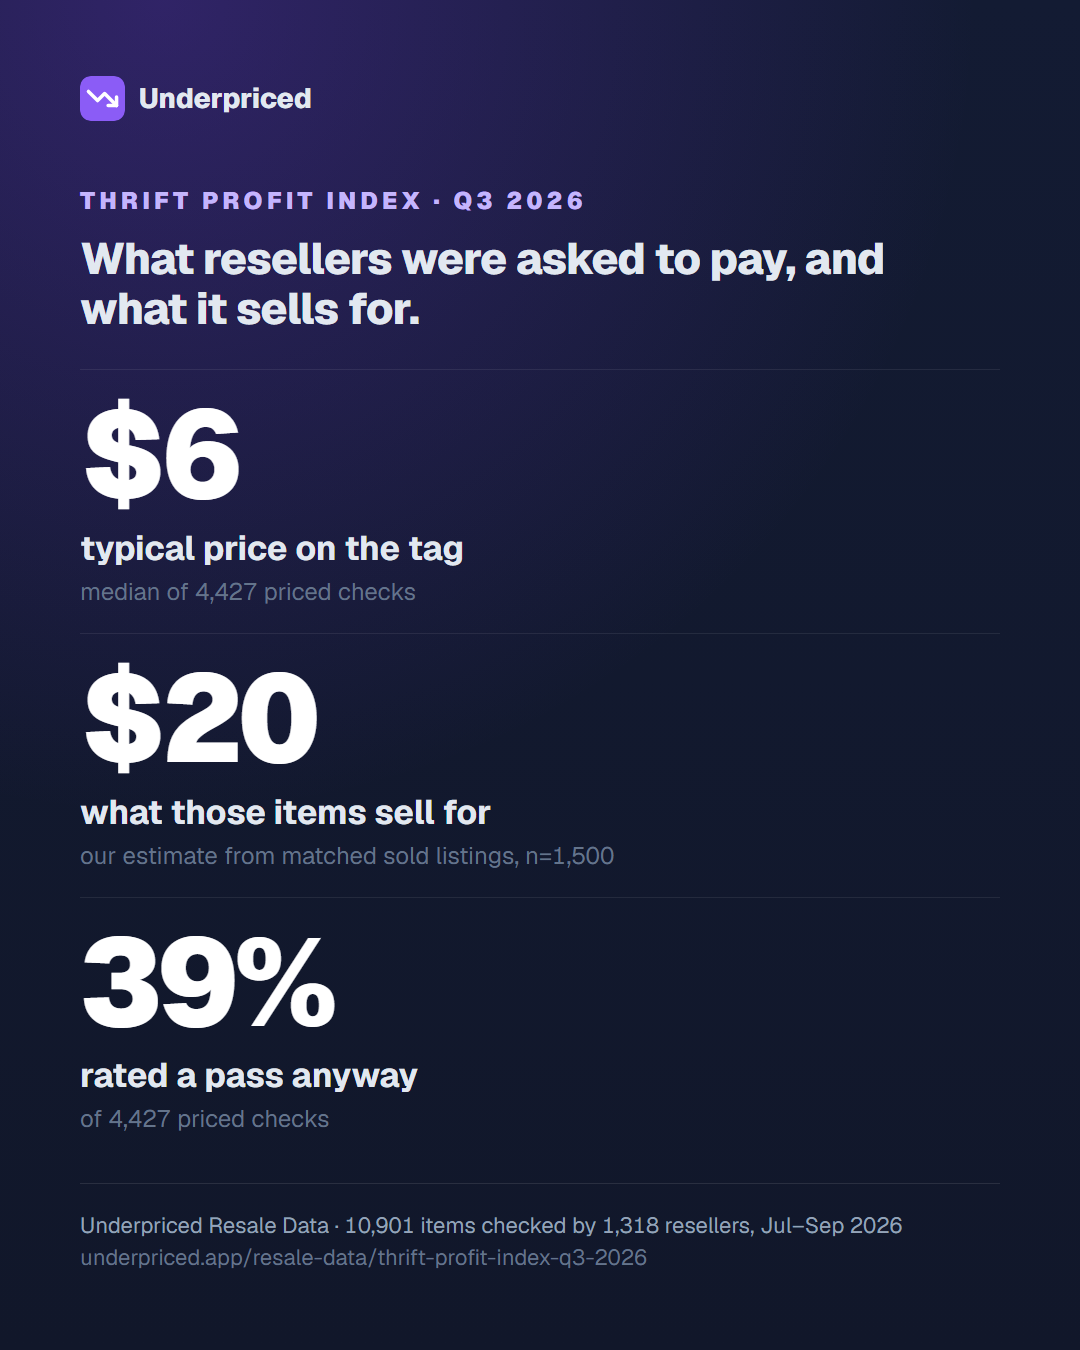
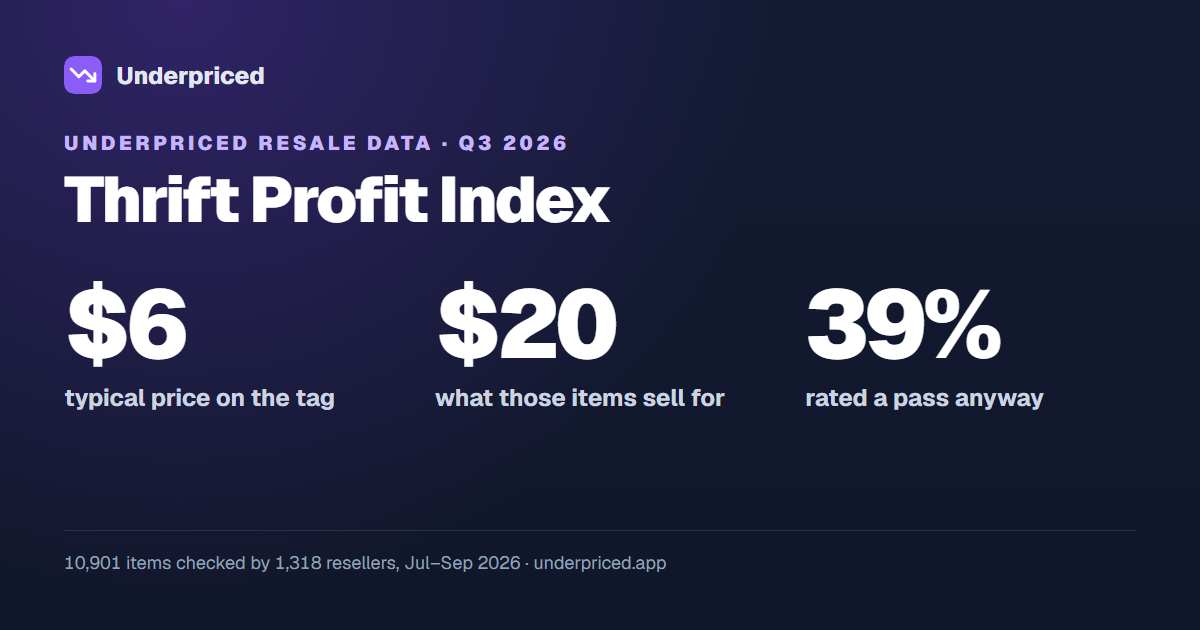
$6typical price on the tagmedian of 4,427 priced checks
$20what those items sell forour estimate from matched sold listings, n=1,500
39%rated a pass anywayof 4,427 priced checks
Where we had both a price and a sold-based value (546 checks), the find was worth a median 3.4x what it cost, and 89% still came out ahead after selling fees and shipping, by a median $10.19.
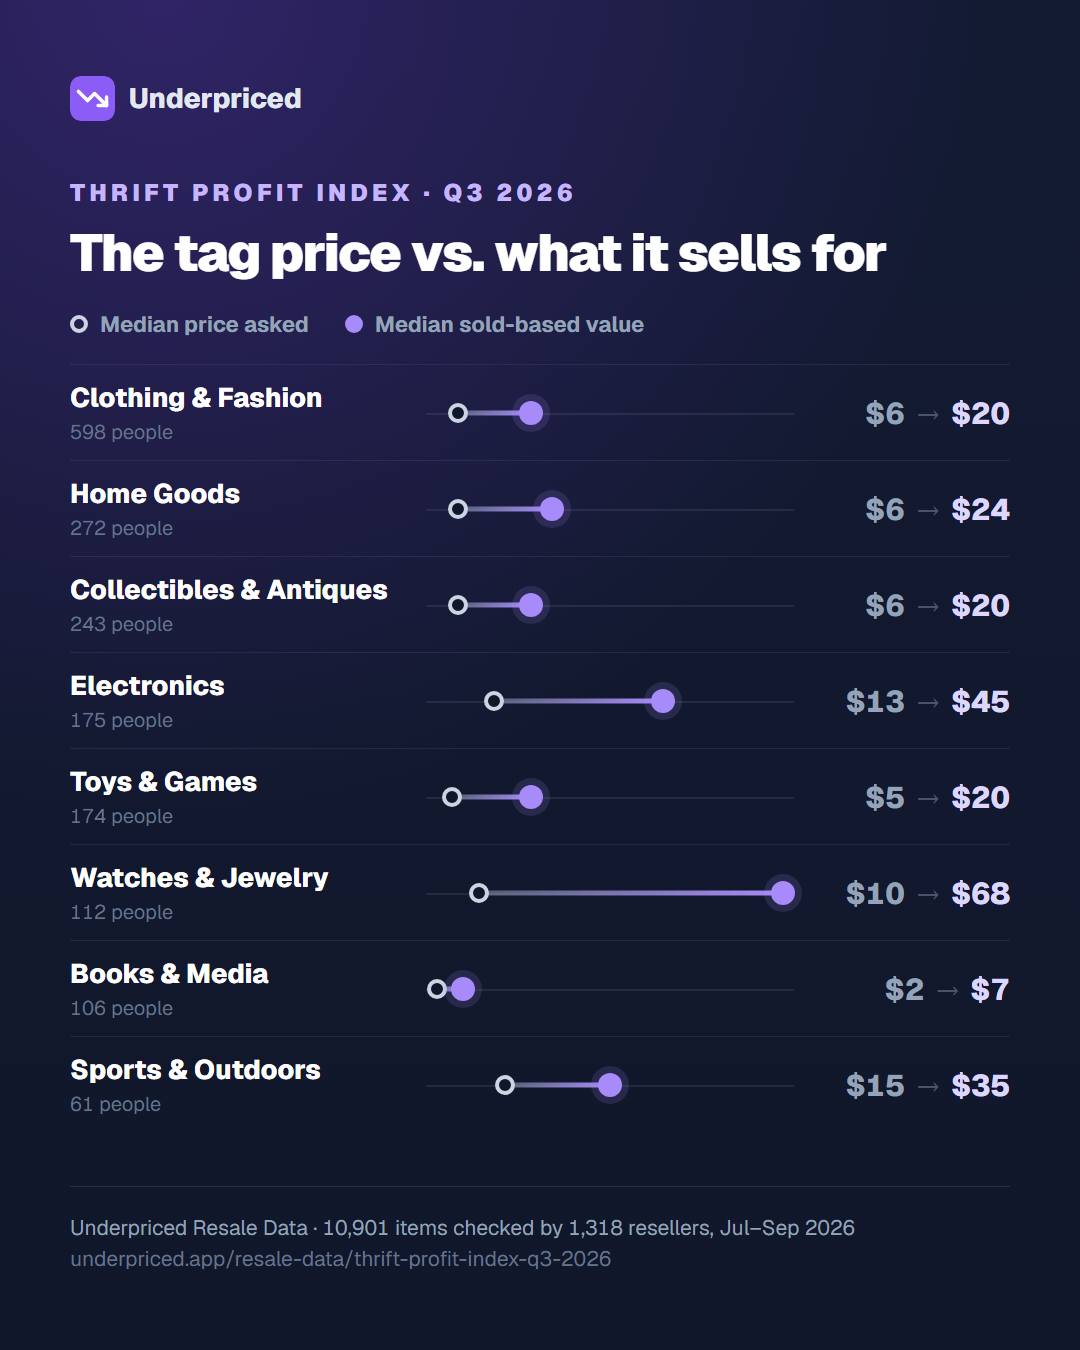
The tag price vs. what it sells for
Each row is a category: the open dot is the median price resellers were asked, the solid dot the median value from matched sold listings. A category gets a row when both numbers clear the floor.
Clothing & Fashion
598 people
$6 asked, sells for $20
Home Goods
272 people
$6 asked, sells for $24
Collectibles & Antiques
243 people
$6 asked, sells for $20
Electronics
175 people
$13 asked, sells for $45
Toys & Games
174 people
$5 asked, sells for $20
Watches & Jewelry
112 people
$10 asked, sells for $68
Books & Media
106 people
$2 asked, sells for $7
Sports & Outdoors
61 people
$15 asked, sells for $35
Art
61 people
$10 asked, sells for $22
Tools & Equipment
50 people
$40 asked, sells for $34
Cameras & Photography
33 people
$20 asked, sells for $38
A dot means fewer than 3 people or 5 checks this quarter. Profit after fees is for checks with both a price and a sold-based value.
Cheap isn’t the same as worth it
Underpriced rates every priced check: worth buying (Hot Deal or Good Deal), fair, or pass (Pass or Bad Deal). A $6 tag didn’t make a find worth buying: 39% of priced checks were a pass and 31% were worth buying.
All checks
4,427 priced
31%30%39%Books & Media
195 priced
17%21%62%Toys & Games
299 priced
23%32%45%Clothing & Fashion
2,342 priced
29%31%41%Home Goods
522 priced
26%35%39%Sports & Outdoors
88 priced
38%24%39%Electronics
183 priced
36%28%37%Art
67 priced
54%15%31%Watches & Jewelry
95 priced
34%37%30%Collectibles & Antiques
412 priced
40%34%27%Tools & Equipment
54 priced
48%26%26%Furniture
56 priced
77%14%
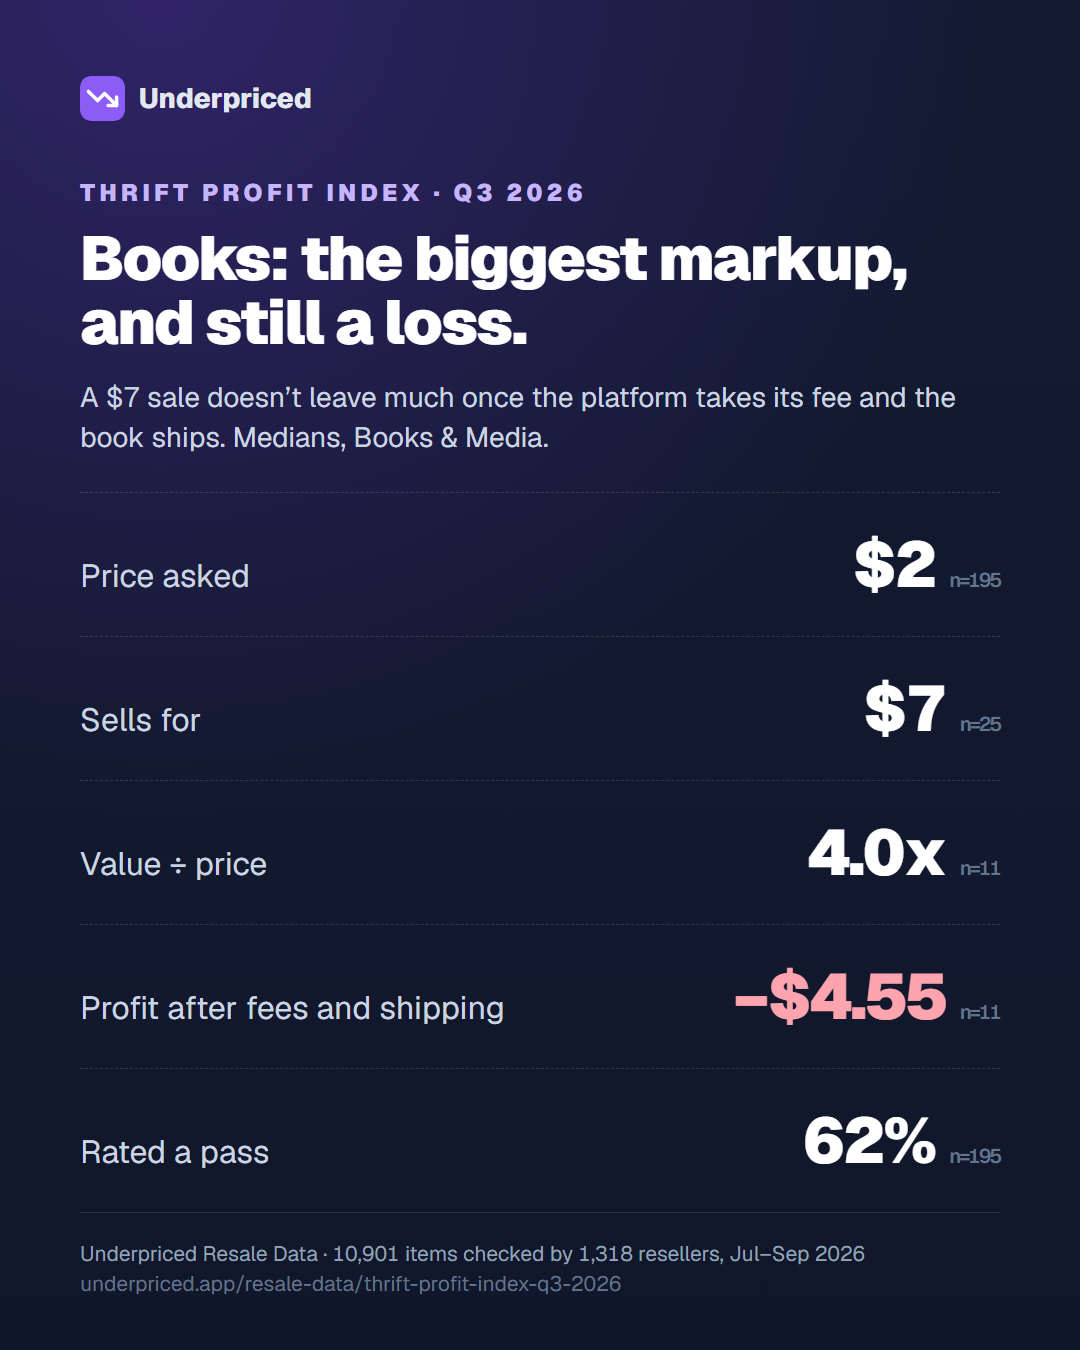
Books: the biggest markup, and still a loss
Books and media were the cheapest thing on the shelf, asked a median $2 (195 priced checks), and they drew a 62% pass rate, the highest of any large category.
On paper the markup looks great: on the 11 checks where we had both numbers, the item was worth a median 4.0x its price. But a $7 sale doesn’t leave much once the platform takes its fee and the book ships, and the median check came out at a $4.55 loss. Only 27% of those checks made money.
That profit figure rests on 11 checks, so treat it as a direction, not a precise number. The pass rate is the solid part.
- Price asked
- $2n=195
- Sells for
- $7n=25
- Value ÷ price
- 4.0xn=11
- Profit after fees and shipping
- −$4.55n=11
- Made money
- 27%n=11
- Rated a pass
- 62%n=195
Books & Media, medians
Clothing is where resellers look
598 of 1,318 resellers checked clothing, more than any other category. Asked $6, worth $20 on 1,198 sold-based values, and 94% of the 370 checks with both numbers made money after fees, a median $11.
Brands resellers checked most
Brands checked by at least 10 people this quarter, with both an asked price and a sold-based value. Most people first.
Compared with Q2 2026
Median price asked, Apr–Jun 2026 vs Jul–Sep 2026, for the categories with enough priced checks in both. We don’t compare ratings across quarters: the way Underpriced rates a deal changed between them, so a shift there says more about us than about thrift stores.
How this was counted
- What the sample is
- Items resellers chose to check in the Underpriced app (web, iPhone, Android and the browser extensions) and the price on the tag or the one they typed in. It isn’t a survey of every thrift store price.
- Who counts
- Every customer account counts in full. Our own and test accounts don’t. The same person checking the same item again within a week counts once.
- The floor
- Every number combines at least 5 checks from at least 3 different people in Q3 2026, and shows its count (n). Below that it’s left out.
- Prices and verdicts
- Medians of US dollar checks that had a price. A $0.01 placeholder counts as no price. Verdicts come from the app at the time of the check.
- Values and profit are our estimate
- A value only counts when matching sold listings priced the item. Projected profit takes off the platform fee, payment processing and shipping as each check worked them out.
The full counting rules, and the running figures by category, are on Underpriced Resale Data.
Using these numbers
You’re welcome to quote any number here with a link back. If you need a cut we didn’t publish, ask: we’ll share it if it clears the same floor.
Cite as
Underpriced Resale Data, Thrift Profit Index Q3 2026 (Jul–Sep 2026), underpriced.app/resale-data/thrift-profit-index-q3-2026
Check your next find before you pay.
Snap a photo in the aisle and see what it sells for and what you’d keep after fees.